Loading Lag
Contents
Overview
Right part is early load, and is grayed out when it waits for the left one to catch up
In Portal 2, the time it takes to load the game after level restart of save load seems to be related to amount of loads you’ve made in your current session (the more you’ve loaded, the longer you wait). The difference is quite absurd, as the loading times on fresh game session can take several seconds at most, while loading the game more than 300 times can increase this time up to 30 seconds. Loading too many times can also lead to a CUtlRBTree overflow crash. This is a major inconvenience for both CM runners (they restart the level pretty often) and potential any% runners (possibility of the game crash mid run).
Krzyhau's Fix (Writeup)
Introduction
The goal of this project is to track down the potential reason of the problem using CS:GO leak and attempt to patch the issue with SAR modification.
Finding the Problem
The first step was to see at what point the game has problems with loading. So I simply recorded a developer console output during early loading and during loading after ~270 saveloads. You can see the video presenting the difference in the video linked.
Thanks to SAR output, I figured out that the biggest lag happens somewhere after CClientState::SetSignonState is executed with state parameter of 6 (SAR uses it to start the session). With small SAR modifications, I’ve narrowed down possible points of lag by printing console messages at various functions I was able to hook into and seeing if they appear before or after the lag. Console logs to narrow down points of lag:
After running the plugin in the game with loading lag existing, you can see it happening right after the print function.
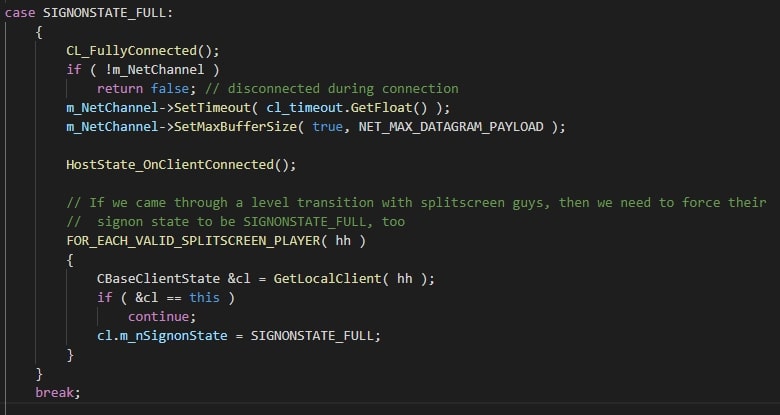
Now I knew the lag happens somewhere within CClientState::SetSignonState function. Since the lag happens only with state parameter equal to 6, I focused on switch case executed when that number is used (SIGNONSTATE_FULL is equal to 6):
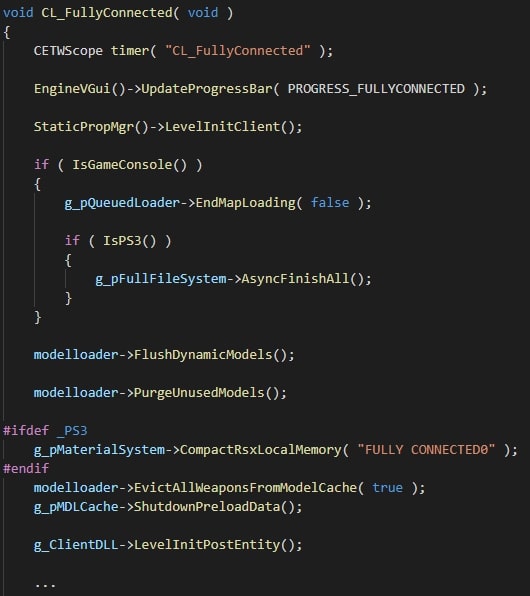
Then, I looked into the CL_FullyConnected function:
Since both EngineVGui and ClientDLL are exposed interface variables, I was able to quickly hook into their function using the method mentioned above. This way, I’ve determined that the lag happens in one of these 4 functions:
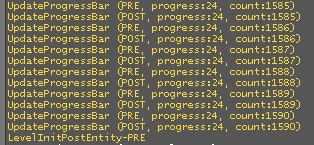
Here’s the fun part though. When hooking into UpdateProgressBar(), I’ve noticed that there’s an incredibly large number of calls to it with parameter 24 - PROGRESS_PRECACHELIGHTING.
I wouldn’t really bother, but shortly before I noticed that it takes a fraction of a second to complete the UpdateProgressBar function. That’s where the sar_disable_progress_bar_update comes from -
it stops the game from executing this function excessively. I thought that’s what I’ve been looking for, but at the end, the best it gives is pretty insignificant timesave.
Regardless, the issue of lag getting bigger is still present. And at this point I was pretty convinced that it wasn’t caused by this, because the count number was pretty constant.
Because of that experiment though, I knew the lag happens after the last UpdateProgressBar() call, which happens within StaticPropMgr()->LevelInitClient().
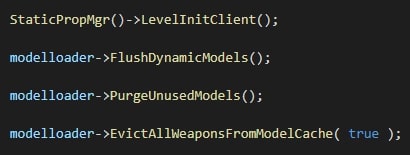
So assuming that UpdatePropVisibility() function (which is the last large function executed in LevelInitClient() after UpdateProgressBar() calls) doesn’t cause the lag, we now know that the lag happens somewhere in modelloader. To be more specific, in one of these 3 functions:
FlushDynamicModels(), which is basicallyInternalUpdateDynamicModels(true)PurgeUnusedModels()EvictAllWeaponsFromModelCache()
So now I had no other choice but to look for a way to access the modelloader interface. It was tough, but after some reverse engineering I was able to get it and call/hook any function that’s within it.
The resulting code may look simple, but finding the right function and offsets was a completely new experience for me, and extremely painful:
With some simple code showing me how long the function takes to execute, I found a guy to blame for all the pain:
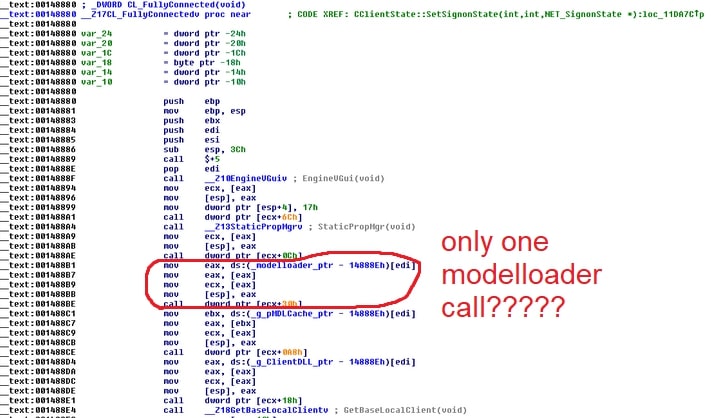
At this point I’ve realized that the leak and Portal 2 code don’t match. I hooked all of previously mentioned modelloader functions and I was getting only one result. After looking into the disassembled engine code I’ve noticed that only one modelloader function is called in CL_FullyConnected.
And even though there’s a risk that I’m making a lot of false assumptions by working with the CS:GO leak from this point, I narrowed down my search to one function:
I’ve already determined that m_Models.Count() is constant between save loads and both this function and UnloadAllModels() simply looped through models using that variable, so I moved my focus to UncacheUnusedMaterials(). Again, materials variable is a global interface, so hooking into the function was pretty easy.
Results speak for themselves:
Calling UncacheUnusedMaterials with bRecomputeStateSnapshots = False
At that point, I could hook UncacheUnusedMaterials and do whatever with it. It has a parameter bRecomputeStateSnapshots, so I was wondering if forcing it to call it with this parameter equal to false would do anything.
Apparently, it gave a huge boost to loading times. I don’t know if it’s required for something, but if it is, then the end result is much less painful than what was happening without the hack, which can in the video linked.
The biggest lag was almost completely gone. However, it’s not the best solution. The crash is still happening, and lags are still present in small amounts during the loading, meaning the “memory leak” is still present.
After looking into the UncacheUnusedMaterials() function, I’ve noticed it loops through records in m_MaterialDict. And suddenly, everything clicked.
The crash was caused by an overflow in that data structure. You can preview how many materials are in there by using the console command mat_showmaterials, and by executing it between loads it’s easy to notice how the number of materials increases. The game simply fails to clear up previously loaded textures.
It seems that the size of this data structure is about 2^16. The game is adding about 200 materials every time you load. If you do the math, it becomes obvious why no one has ever reached 400 loads.
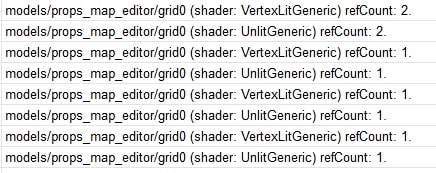
So, what made me curious is what these suspicious 200 materials are. I logged two data samples into the text file, then compared them to see what has been added, and um…
All of the materials are map maker related. All of them.
I didn’t really bother to investigate what causes this issue in specific, but what happens is every time you load into a map or a save, the game loads about 200 textures related to map maker, and then fails to clear up the previous ones, creating an endless list of copies of the same material.
Valve employees have done it again!
Fixing the Problem
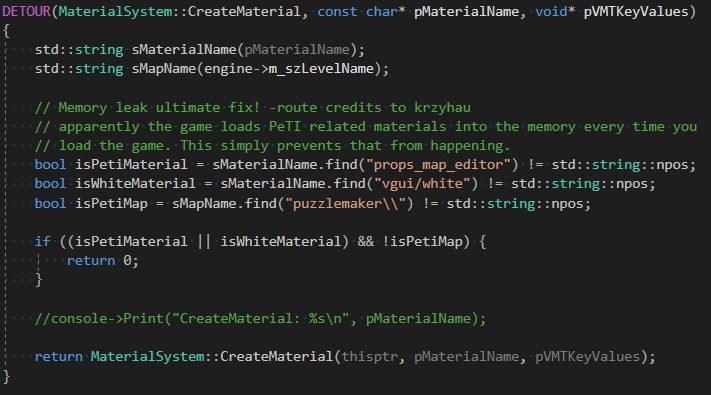
I’ve literally just hooked into CreateMaterial function and rejected it if both material name is PeTI related and current map is not. That’s a whole thing:
As a result, we were able to test the game getting to 1000 demos within an hour, without restarting the game, and without a crash.


